View Monitoring Dashboard (Enterprise Edition)
Use Monitoring to View System Monitoring
Enterprise Edition provides a Monitoring page in the Admin UI for viewing system monitoring data and alert status. Administrators can query metrics, view alert rules, check target collection status, and view Prometheus runtime information on this page.
Query Monitoring Metrics
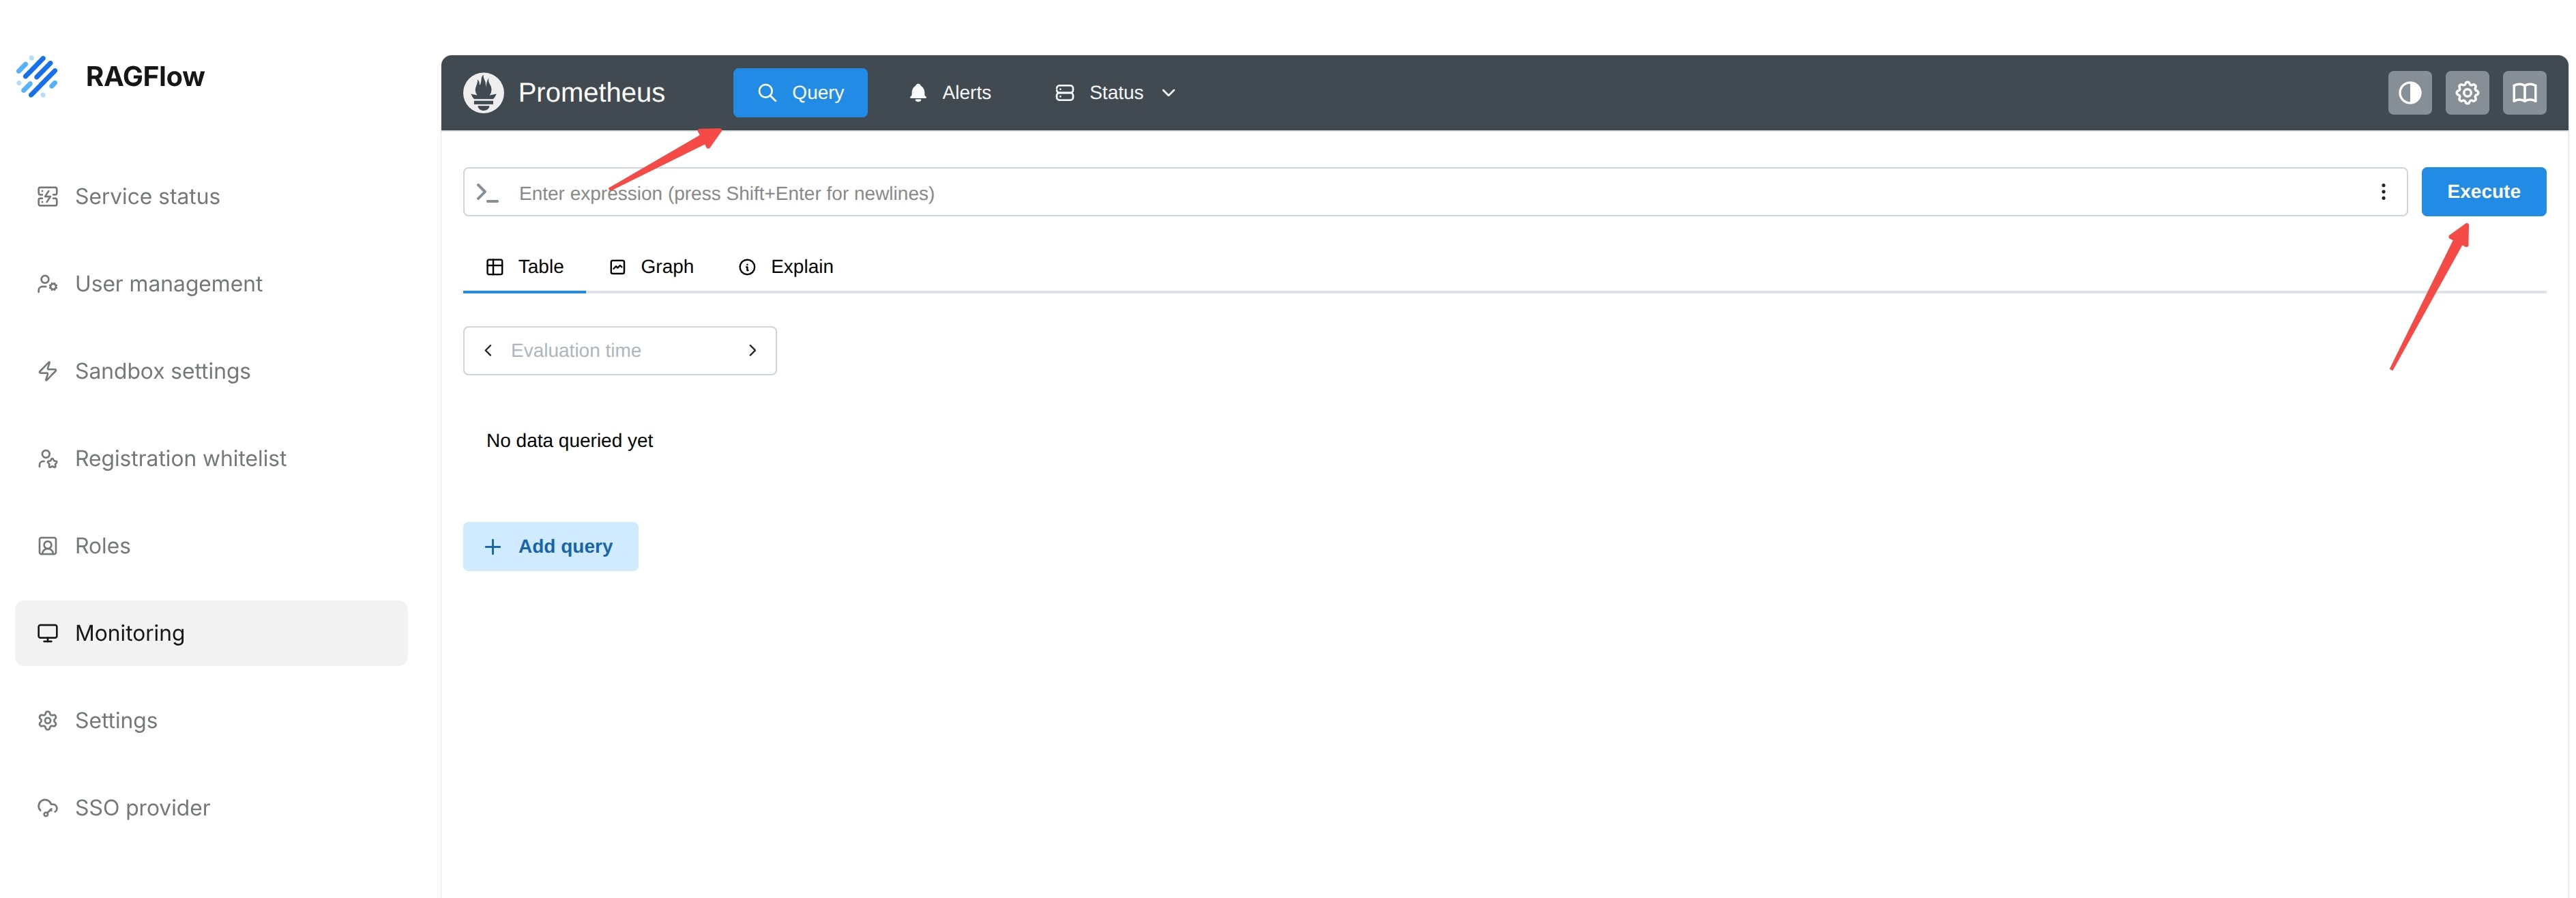
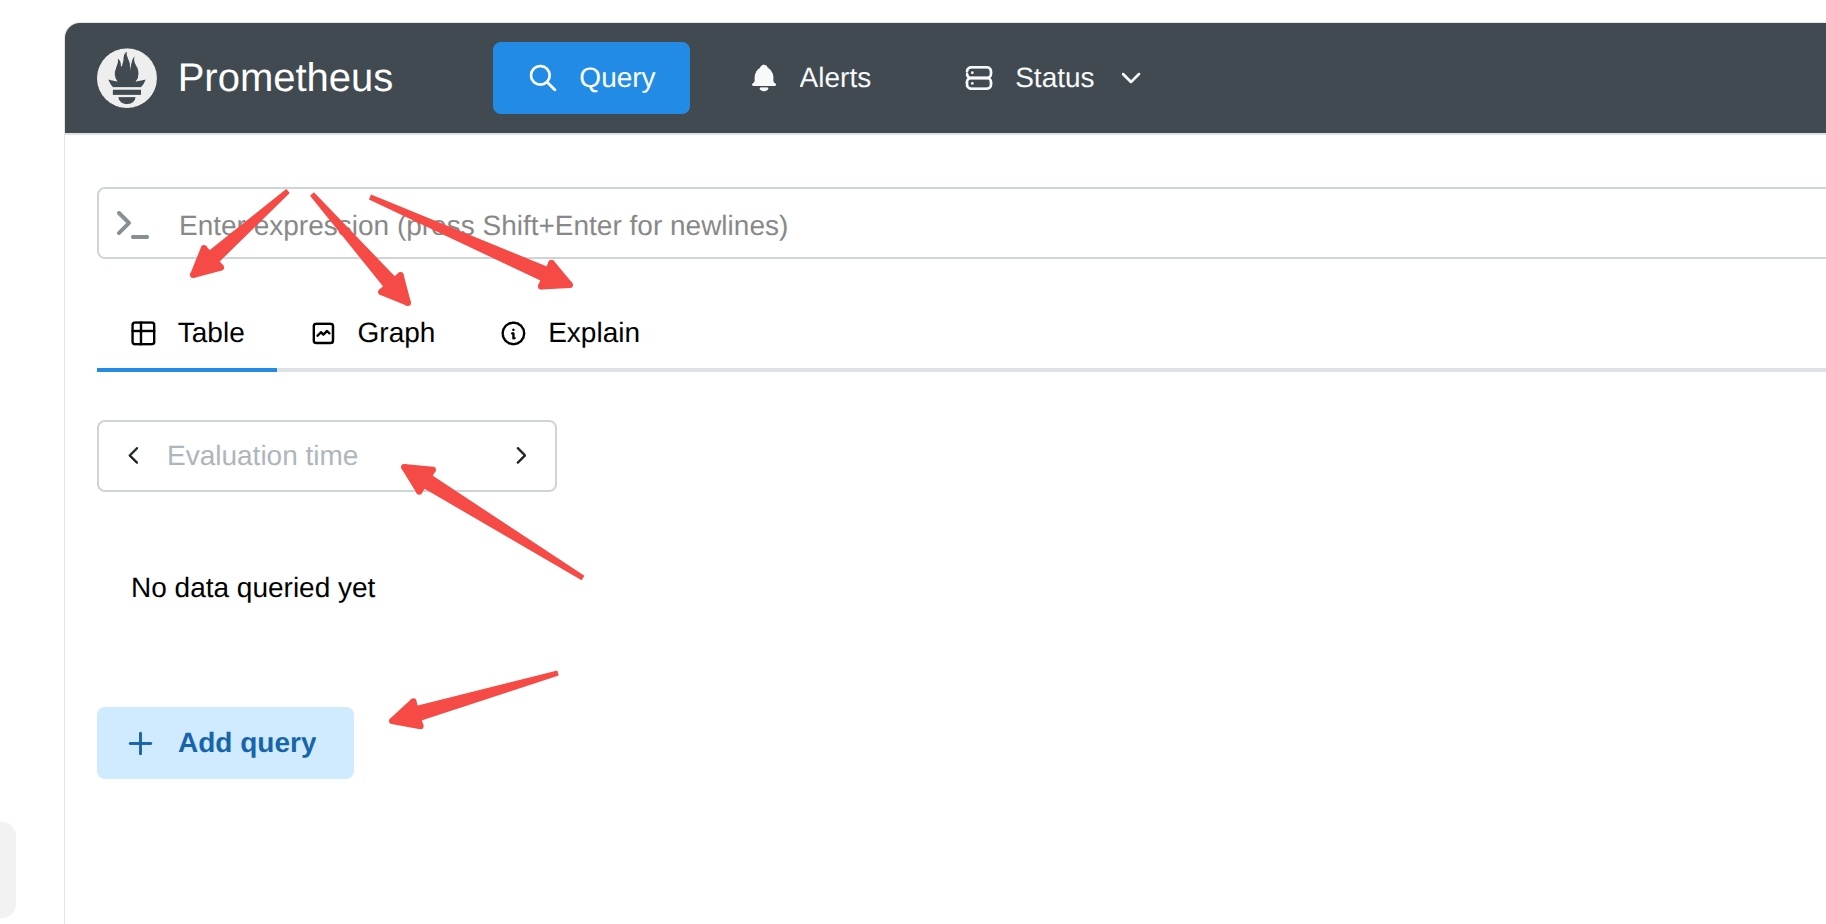
Select Query at the top of the Monitoring page to enter the metric query page. The page provides an expression input box. Administrators can enter a Prometheus query expression and click Execute.
Query results can be viewed through Table, Graph, and Explain:
| View | Description |
|---|---|
Table | View query results in table form. |
Graph | View trend charts. |
Explain | View an explanation of the query expression. |
The page also provides Evaluation time, which is used to view or adjust the query evaluation time. To query multiple expressions at the same time, click Add query to add a new query area.
- Go to the Monitoring page.
- Select Query.
- Enter the query expression in the input box.
- Click Execute.
- Switch between Table, Graph, and Explain as needed to view results.
- To add query conditions, click Add query.
Note: The Query page is used to query monitoring metrics, not to modify business data. Query expressions must comply with Prometheus query rules. Complex queries may bring computing overhead, so avoid frequently running high-cost queries in production environments.
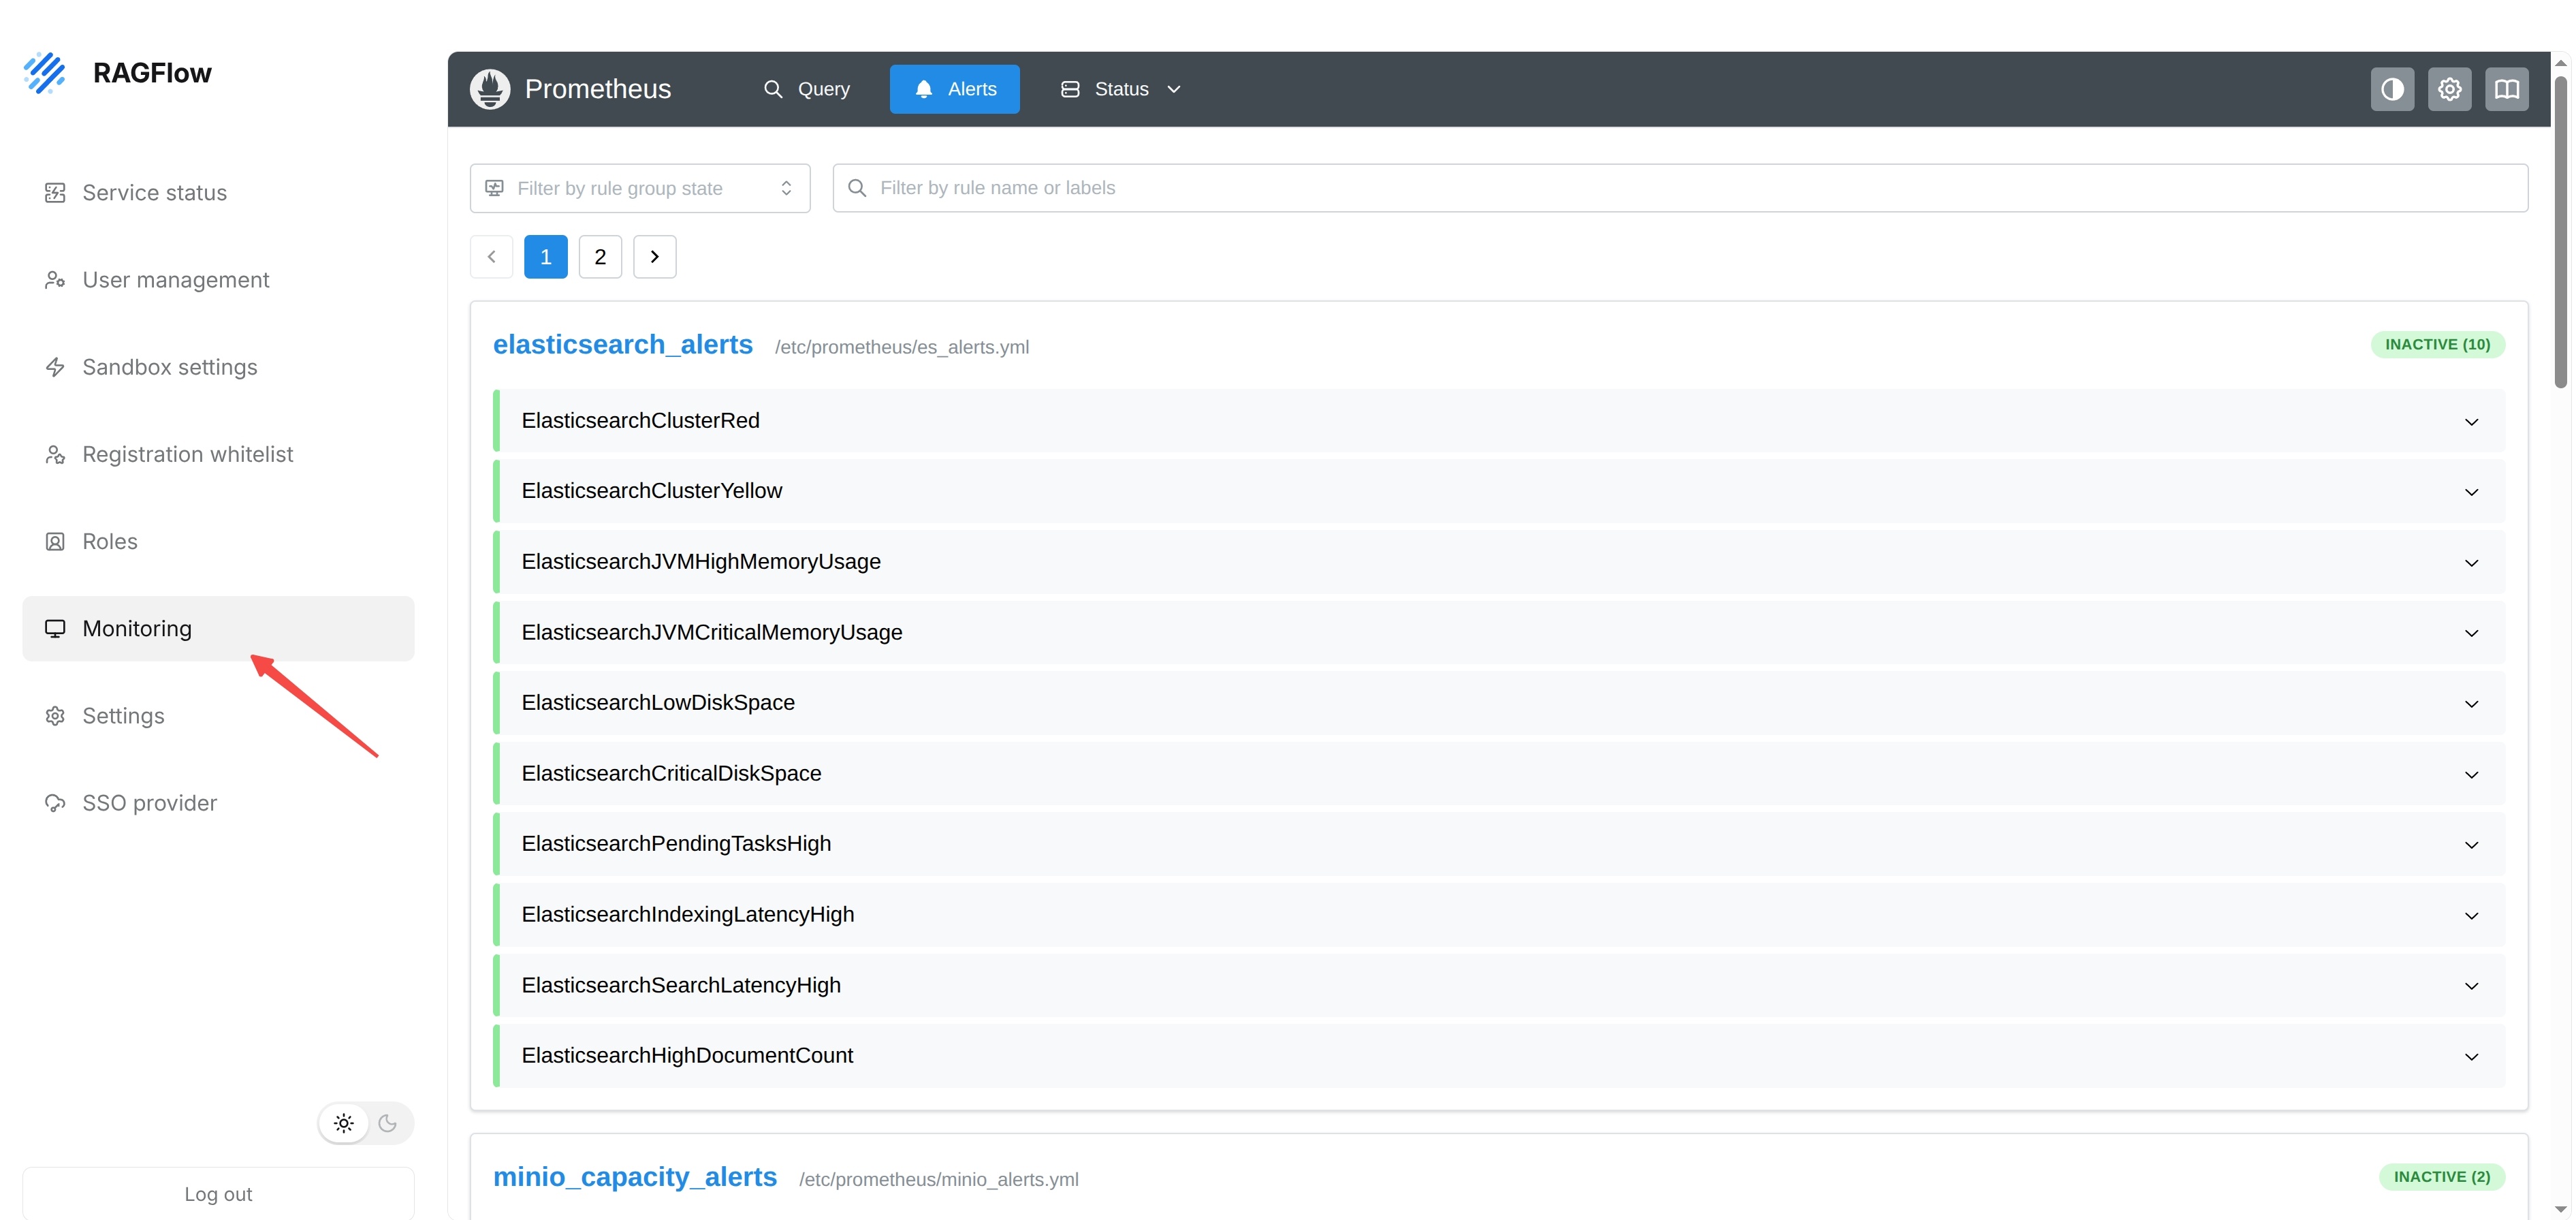
View Alert Rules and Alert Status
Select Alerts to view alert rules currently configured in Prometheus. The page supports filtering alert groups by rule group state and searching rules by rule name or labels.
The alerts page displays content by rule group. Each rule group shows the rule group name, rule file path, and current status statistics, such as INACTIVE or FIRING. Administrators can expand a specific rule to check whether it is currently triggered.
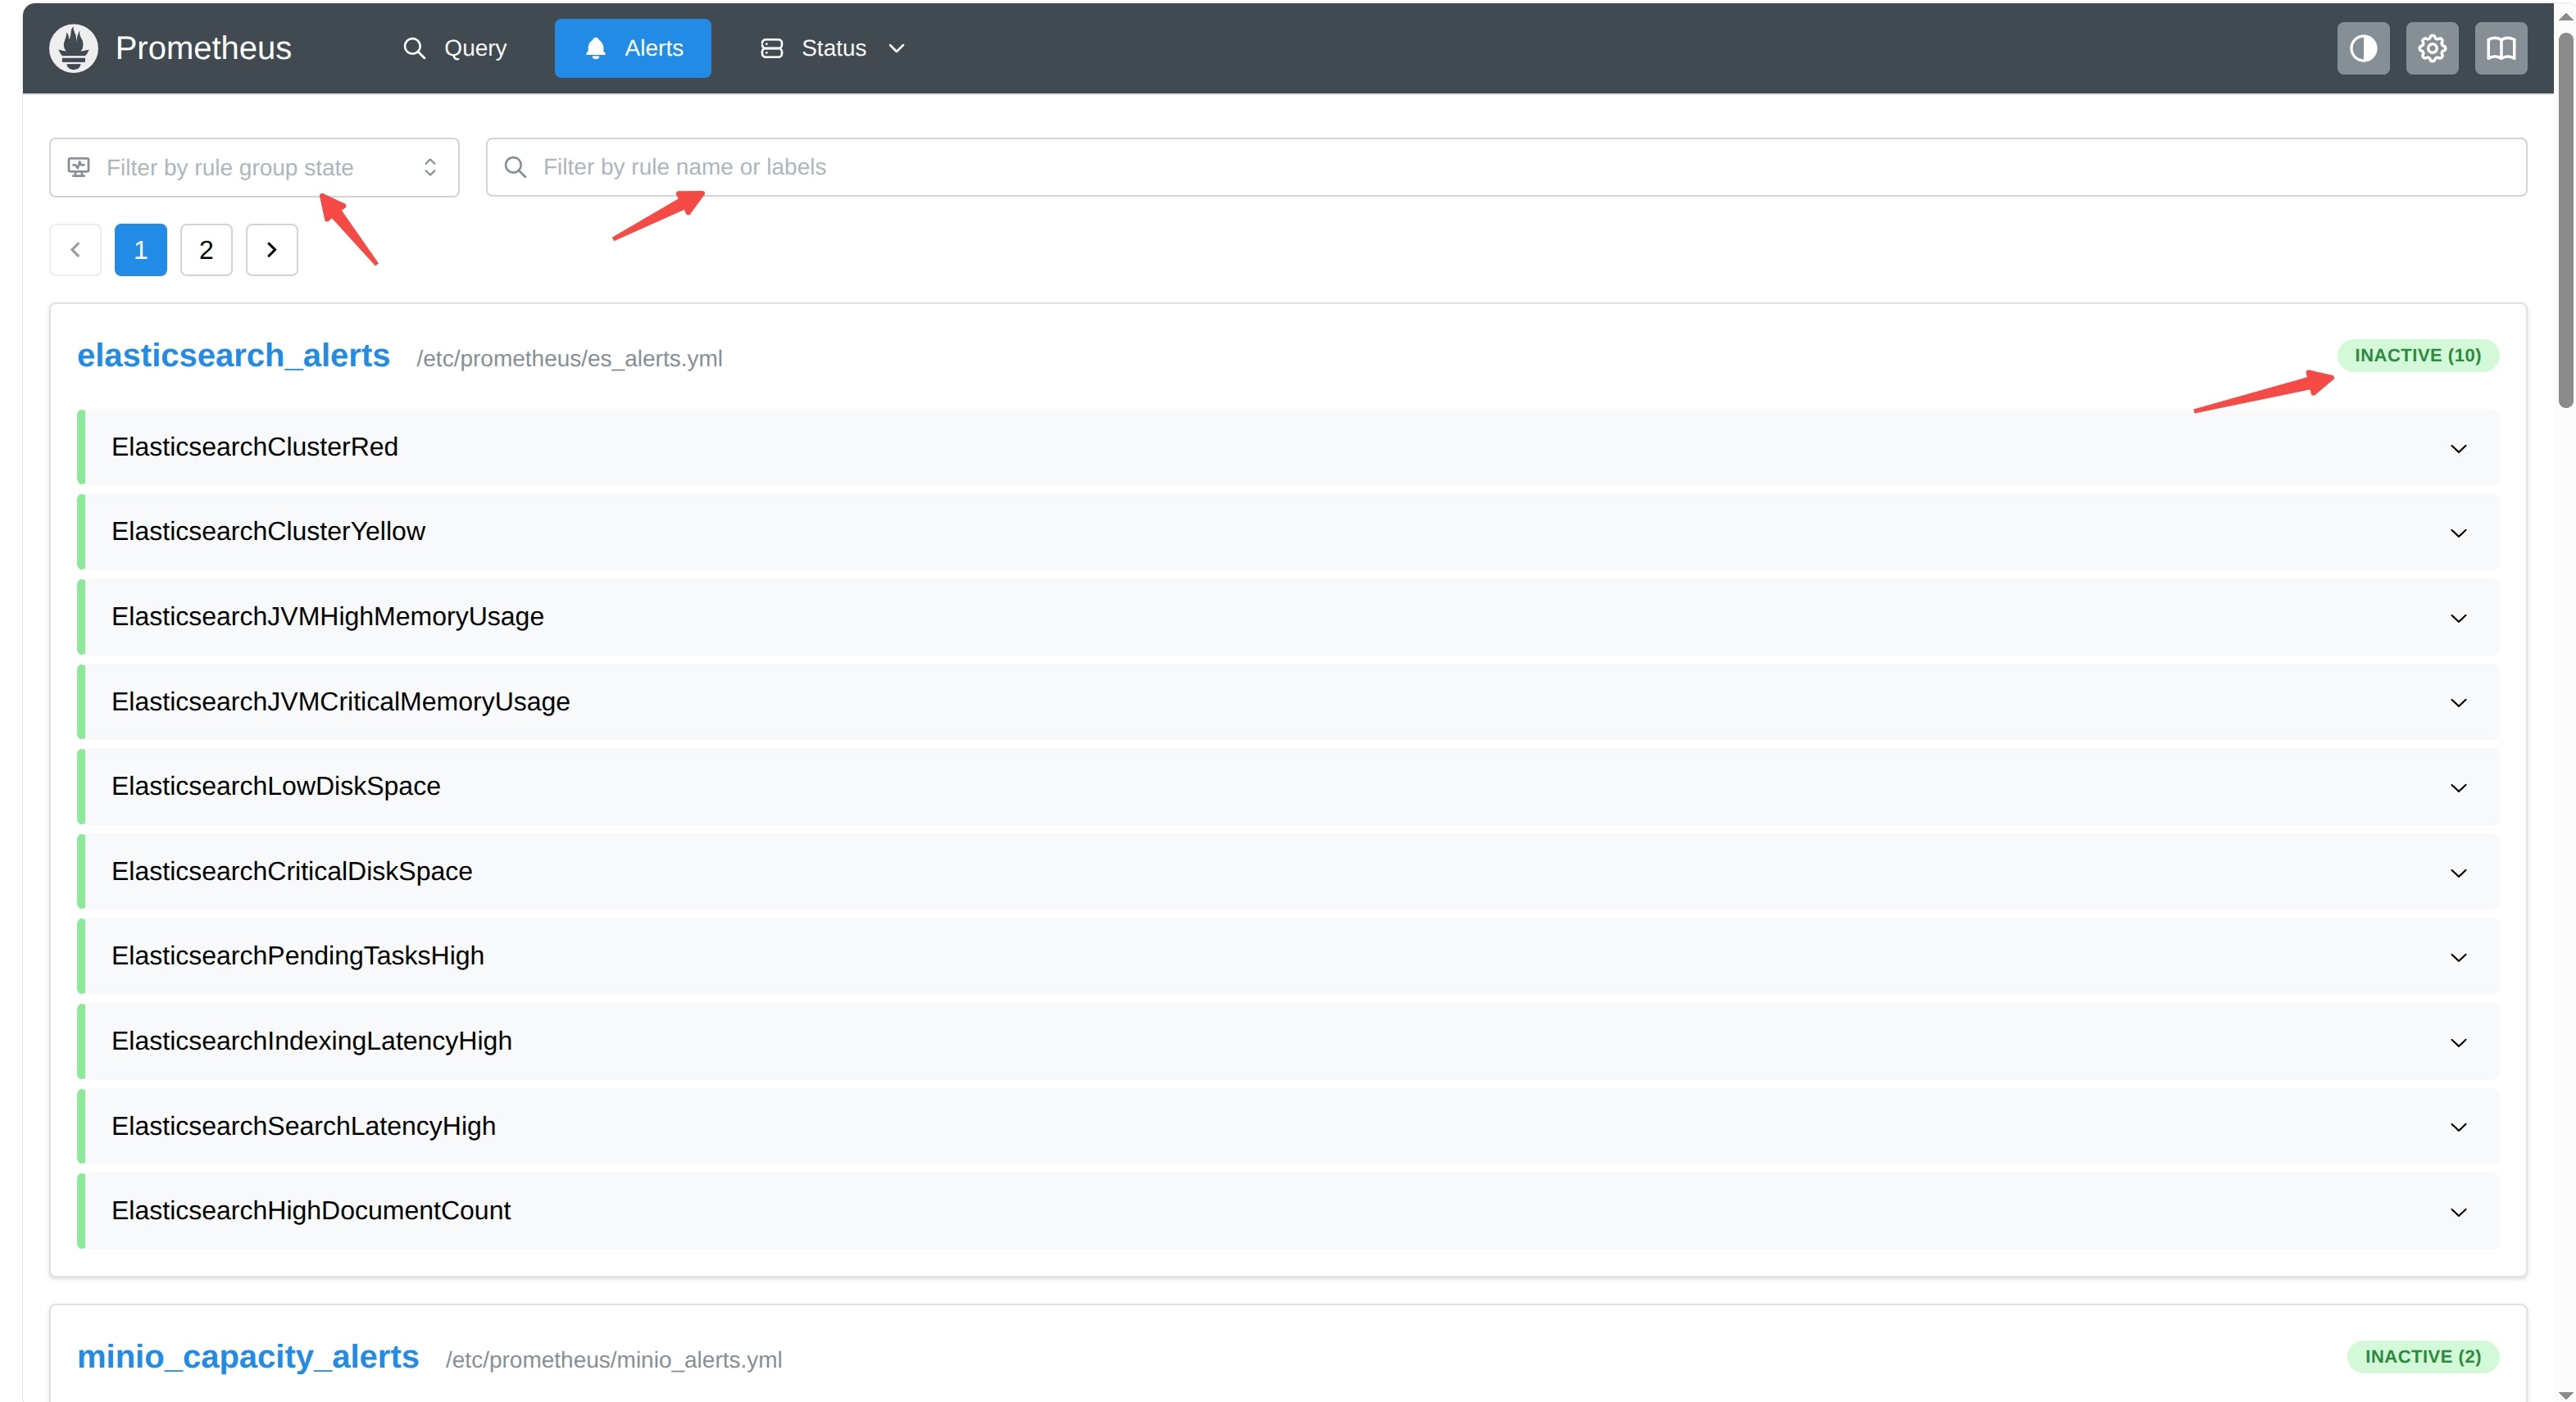
Note: The Alerts page displays alert rules loaded by Prometheus in the current deployment. INACTIVE means the rule is not currently triggered. FIRING means the rule is currently triggered, and administrators need to further troubleshoot with service status, logs, and the deployment environment. Query expressions must comply with Prometheus query rules. Complex queries may bring computing overhead, so avoid frequently running high-cost queries in production environments.
View Prometheus Monitoring Status
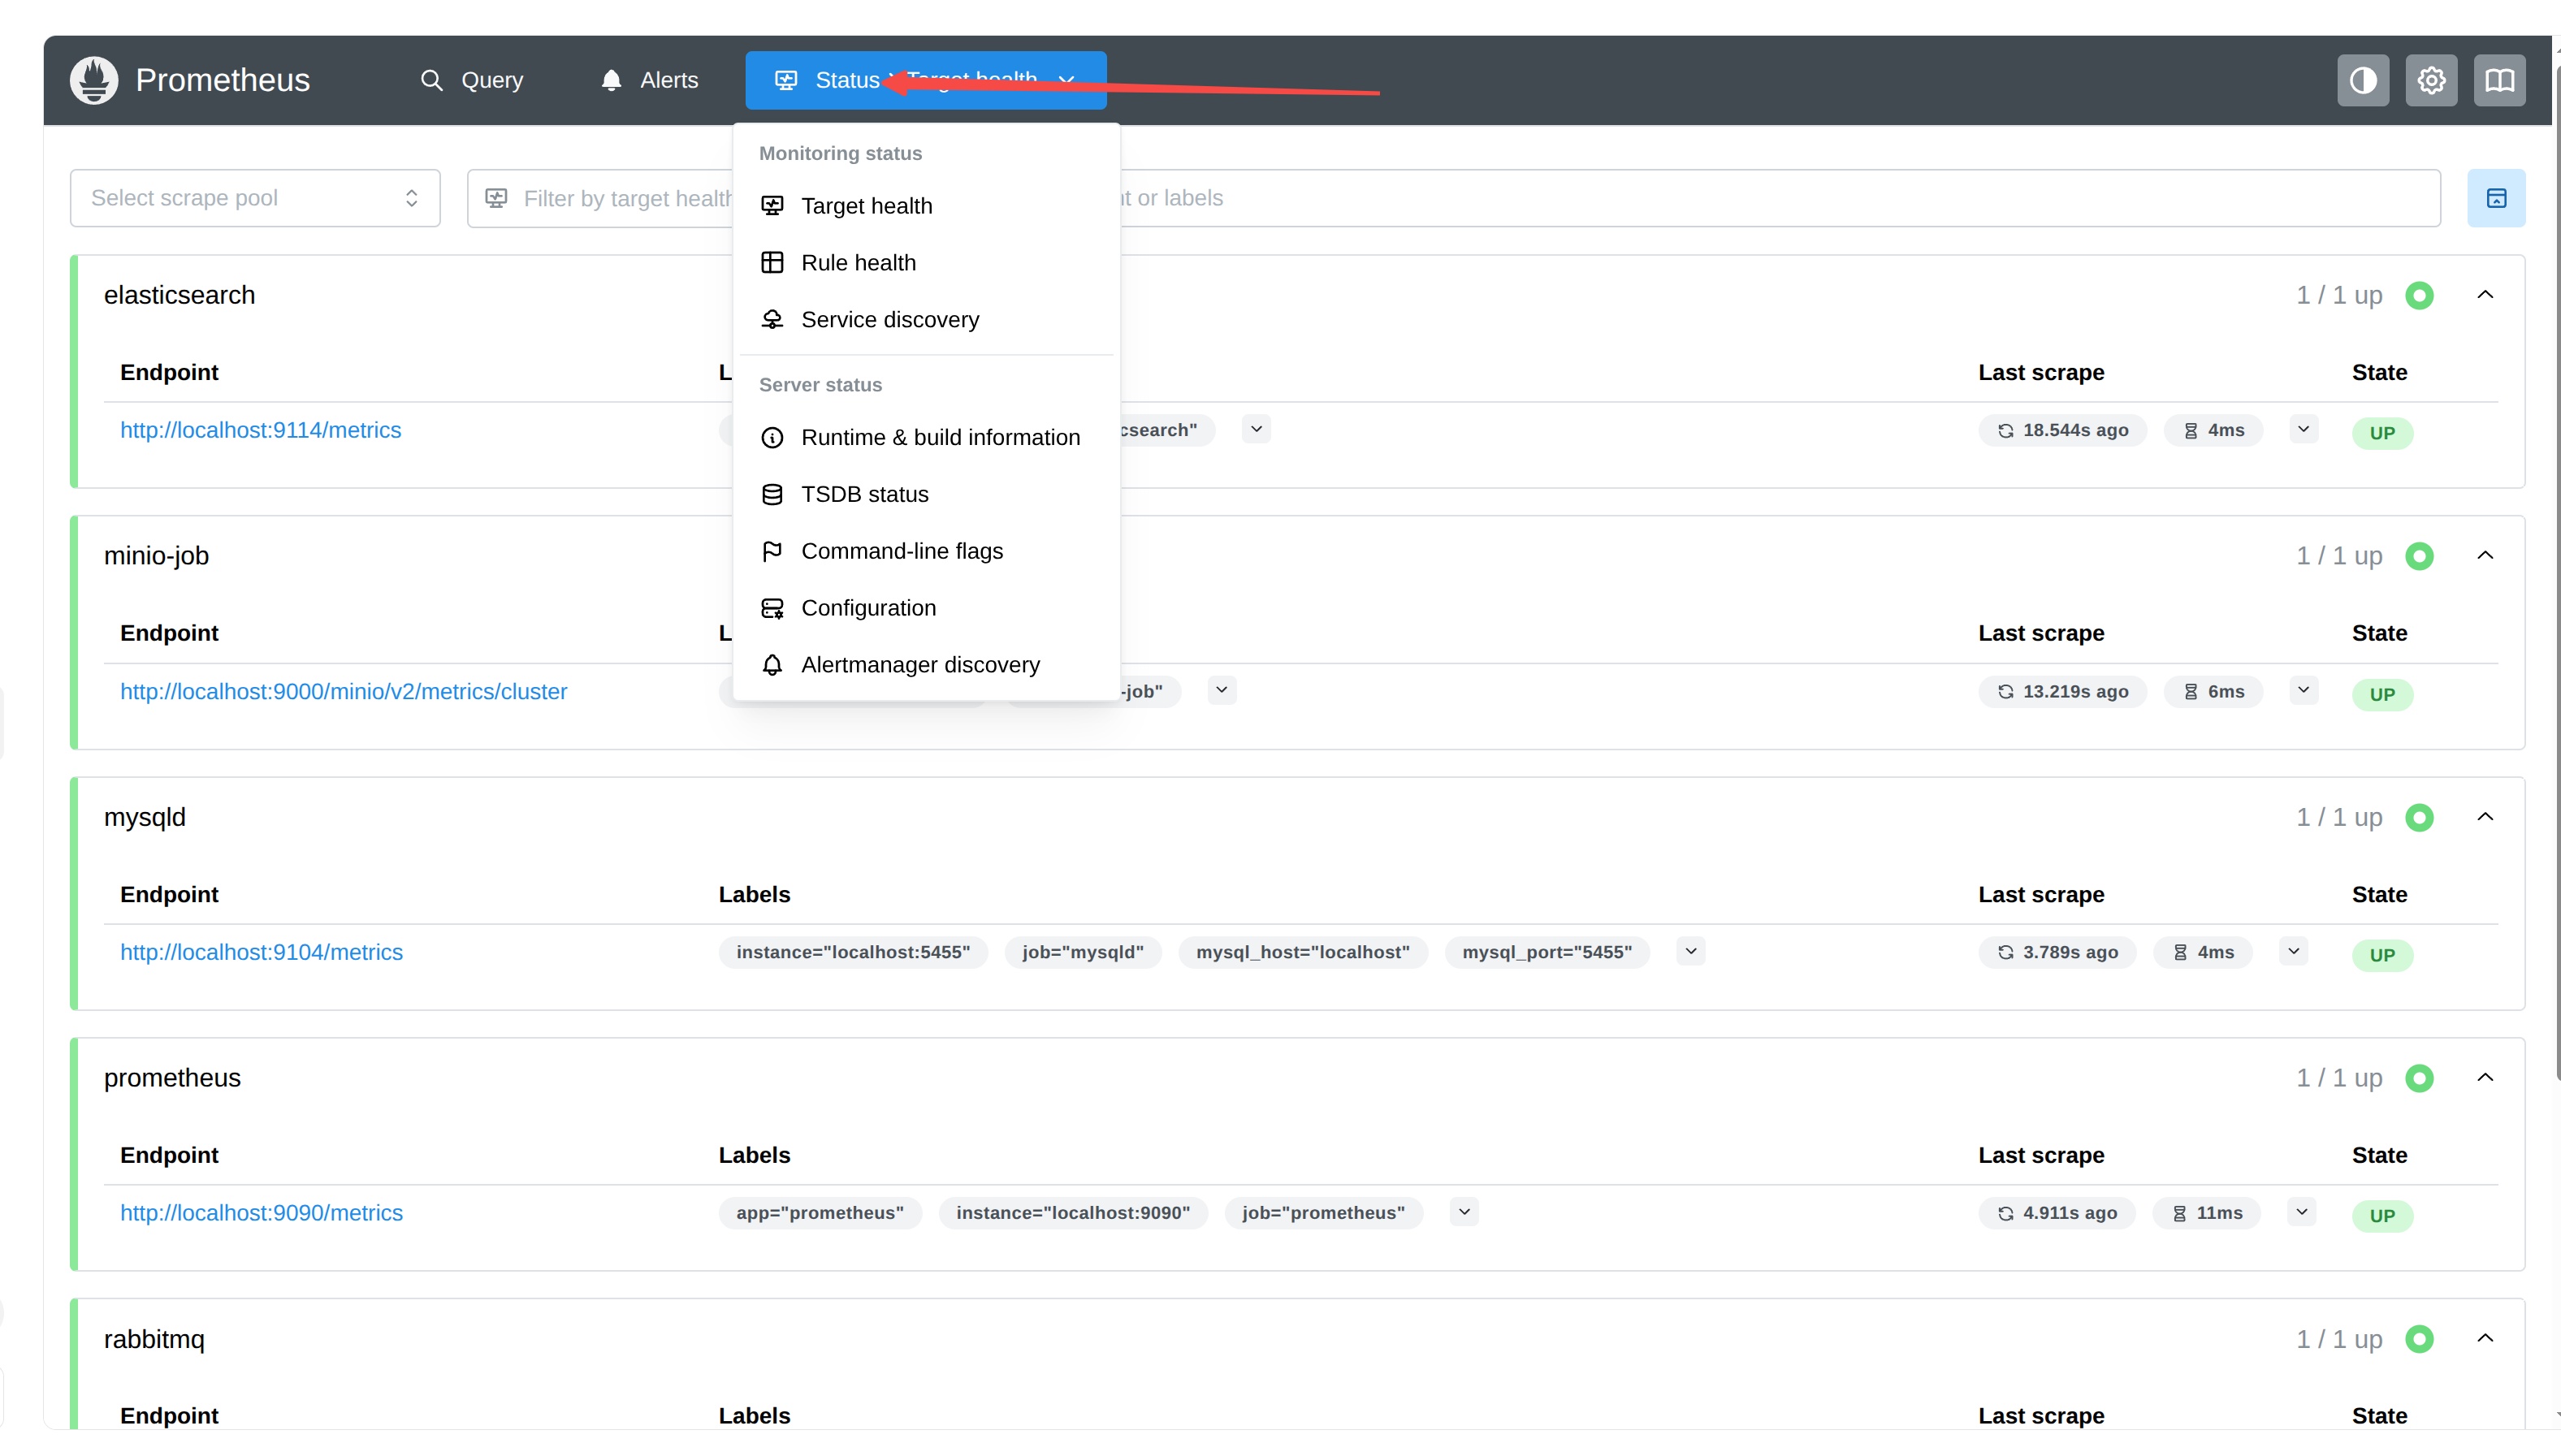
Prometheus provides rich status pages. Administrators can use the Status menu to view collection targets, service discovery, rule execution, the time-series database, system configuration, and runtime status. This helps quickly confirm whether the monitoring service is running normally and assists in locating monitoring configuration or collection exceptions.
| Menu | Function | Main content | Administrator use | Notes |
|---|---|---|---|---|
Target health | View the health status of Prometheus collection targets. | Displays collection targets by Job, including Endpoint, Labels, Last Scrape, State, and other information. State is UP when target collection is normal. | Confirm whether Elasticsearch, MySQL, Redis, MinIO, RabbitMQ, Prometheus, and other components can be monitored normally. | Target Health only indicates metric collection status and does not fully represent business service status. If the status is DOWN, check the exporter, network connectivity, scrape address, and Prometheus configuration. |
Rule health | View the runtime status of alerting rules and recording rules. | Displays rule groups, rule files, recent execution time (Last Run), execution duration (Took), execution period (Every), and rule status. | Confirm whether rules run at the expected interval and troubleshoot rule exceptions or invalid rules. | OK means the latest rule evaluation succeeded. |
Service discovery | View Prometheus service discovery results. | Displays each job's Discovered Labels and Target Labels, and supports viewing the relabeling process. | Troubleshoot abnormal target discovery, incorrect label configuration, or abnormal metric classification. | When a new monitoring target does not take effect, check this page first. |
Runtime & build information | View Prometheus runtime environment and build information. | Includes Version, Build Date, Go Version, Start Time, Hostname, Storage Retention, Configuration Reload, and other information. | Confirm the current runtime version, startup time, configuration loading status, and storage retention policy. | Commonly used to troubleshoot Prometheus service runtime status. |
TSDB status | View the runtime status of the Prometheus time-series database (TSDB). | Includes Series, Chunks, Label Pairs, time range, labels, metrics, memory usage, and other statistics. | View monitoring data scale, storage status, and database runtime status. | The page provides operations such as Delete Series and Clean Tombstones. It is recommended only for status viewing. Do not execute delete or cleanup operations casually, or historical monitoring data may be lost. |
Command-line flags | View the current Prometheus startup parameters. | Displays the configuration file path, listen address, storage path, retention time, query parameters, and other startup parameters. | Check whether the actual Prometheus startup parameters match deployment expectations. | Suitable for troubleshooting configuration file paths, data directories, listen ports, and similar issues. |
Configuration | View the currently loaded Prometheus configuration. | Includes complete configuration content such as global, scrape_configs, rule_files, and alerting. | Confirm whether scrape jobs, scrape intervals, alert rules, and scrape configurations have been loaded correctly. | This page is for viewing only and does not support online modification. Reload or restart Prometheus after modifying the configuration. |
Alertmanager discovery | View Alertmanager instances discovered by Prometheus. | Displays Alertmanager service addresses and connection status. | Confirm whether Prometheus has successfully connected to Alertmanager. | If Alertmanager is not configured, this page may be empty. |