Check System Status
Check Whether Services Are Running Normally
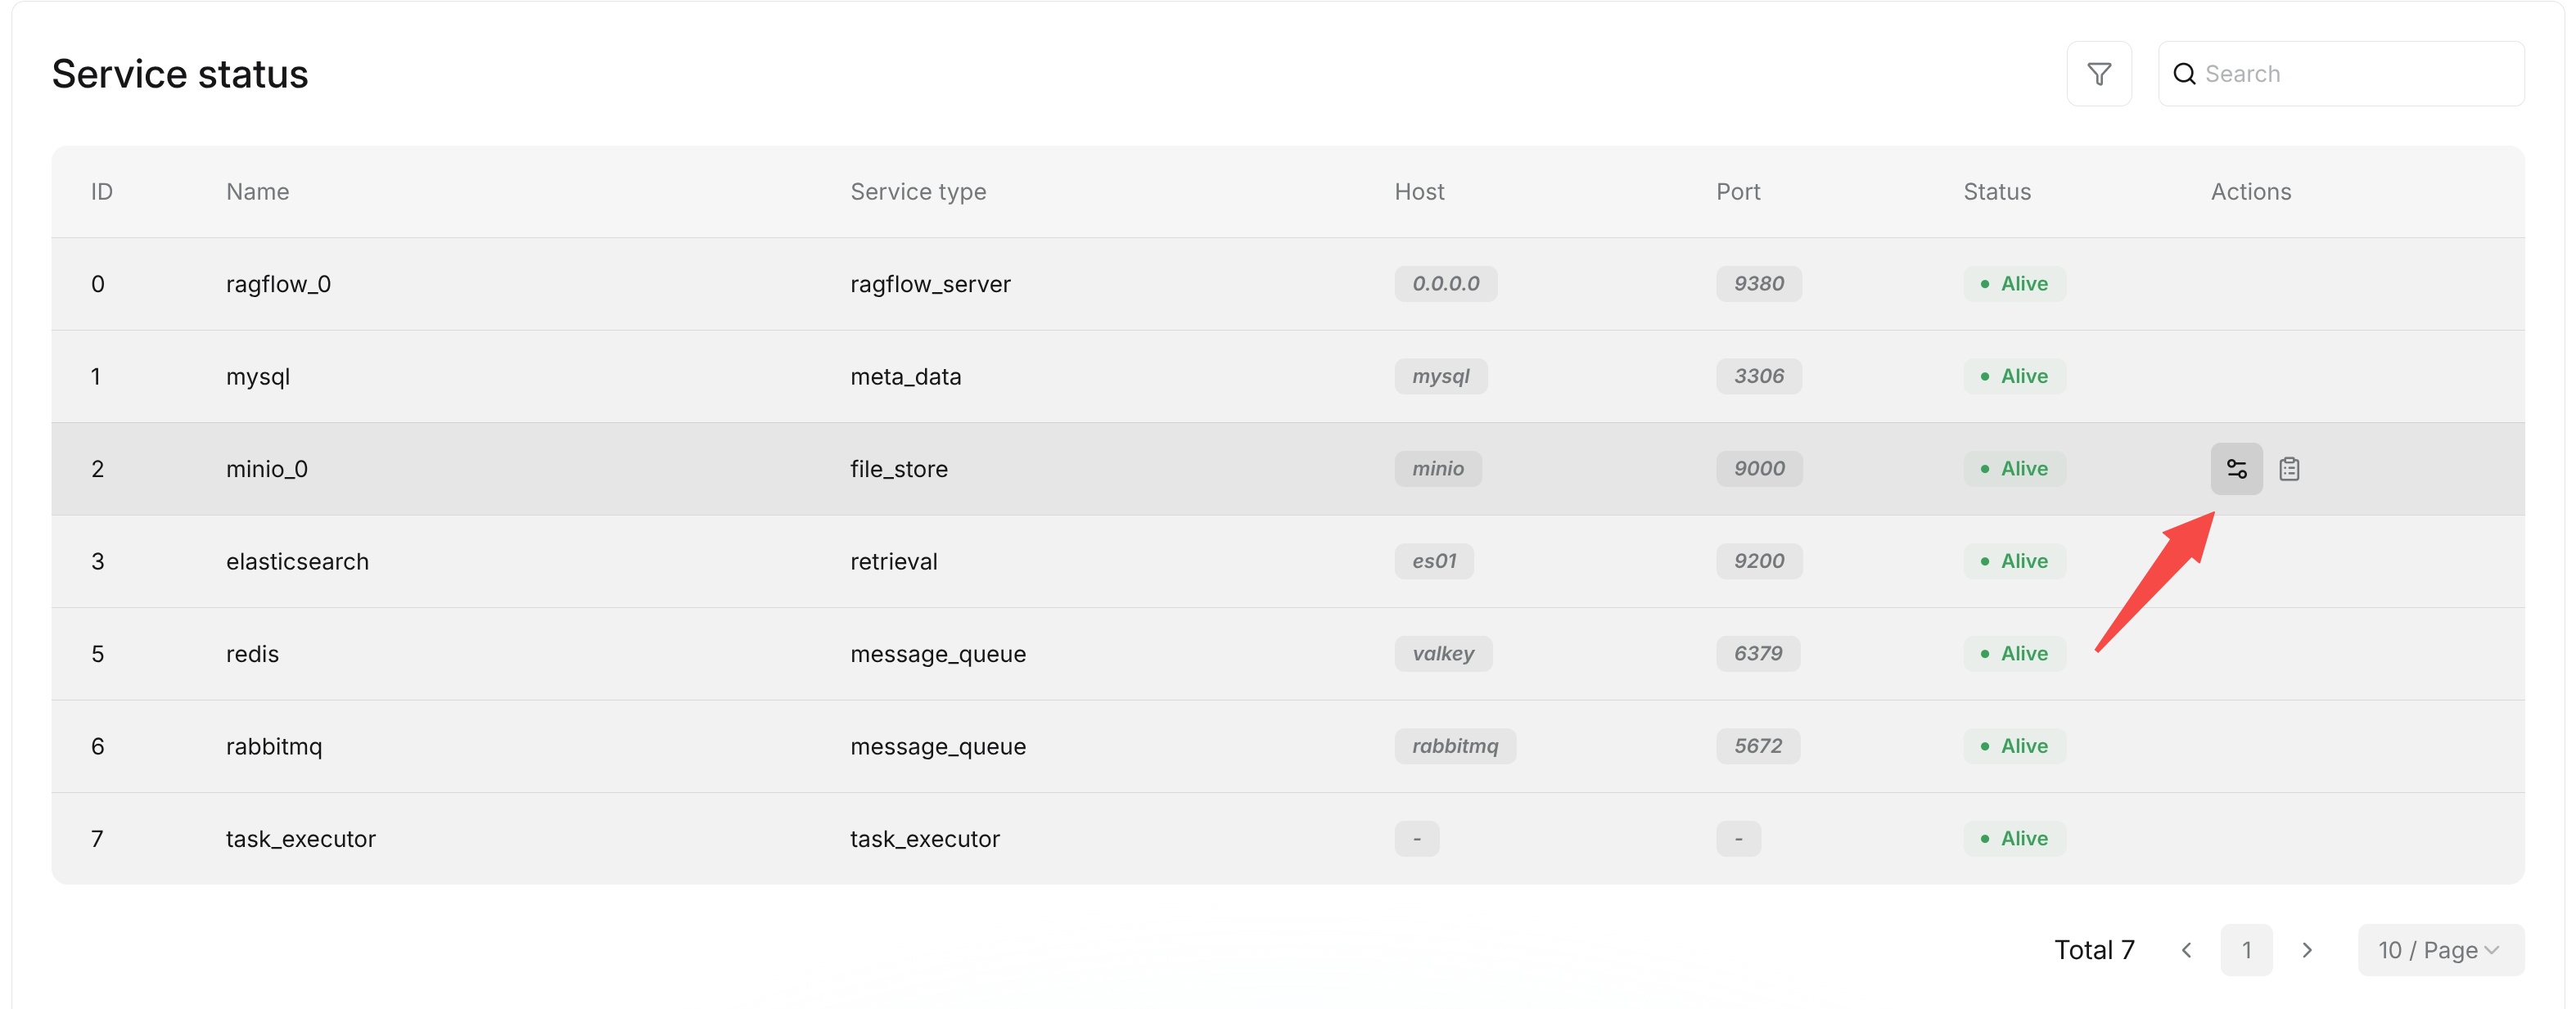
After entering the Admin UI, open the Service status page to view the status reported by the Go services and their configured dependencies. Each row contains the service type, name, host, port, status, an elapsed diagnostic value, and an optional message.
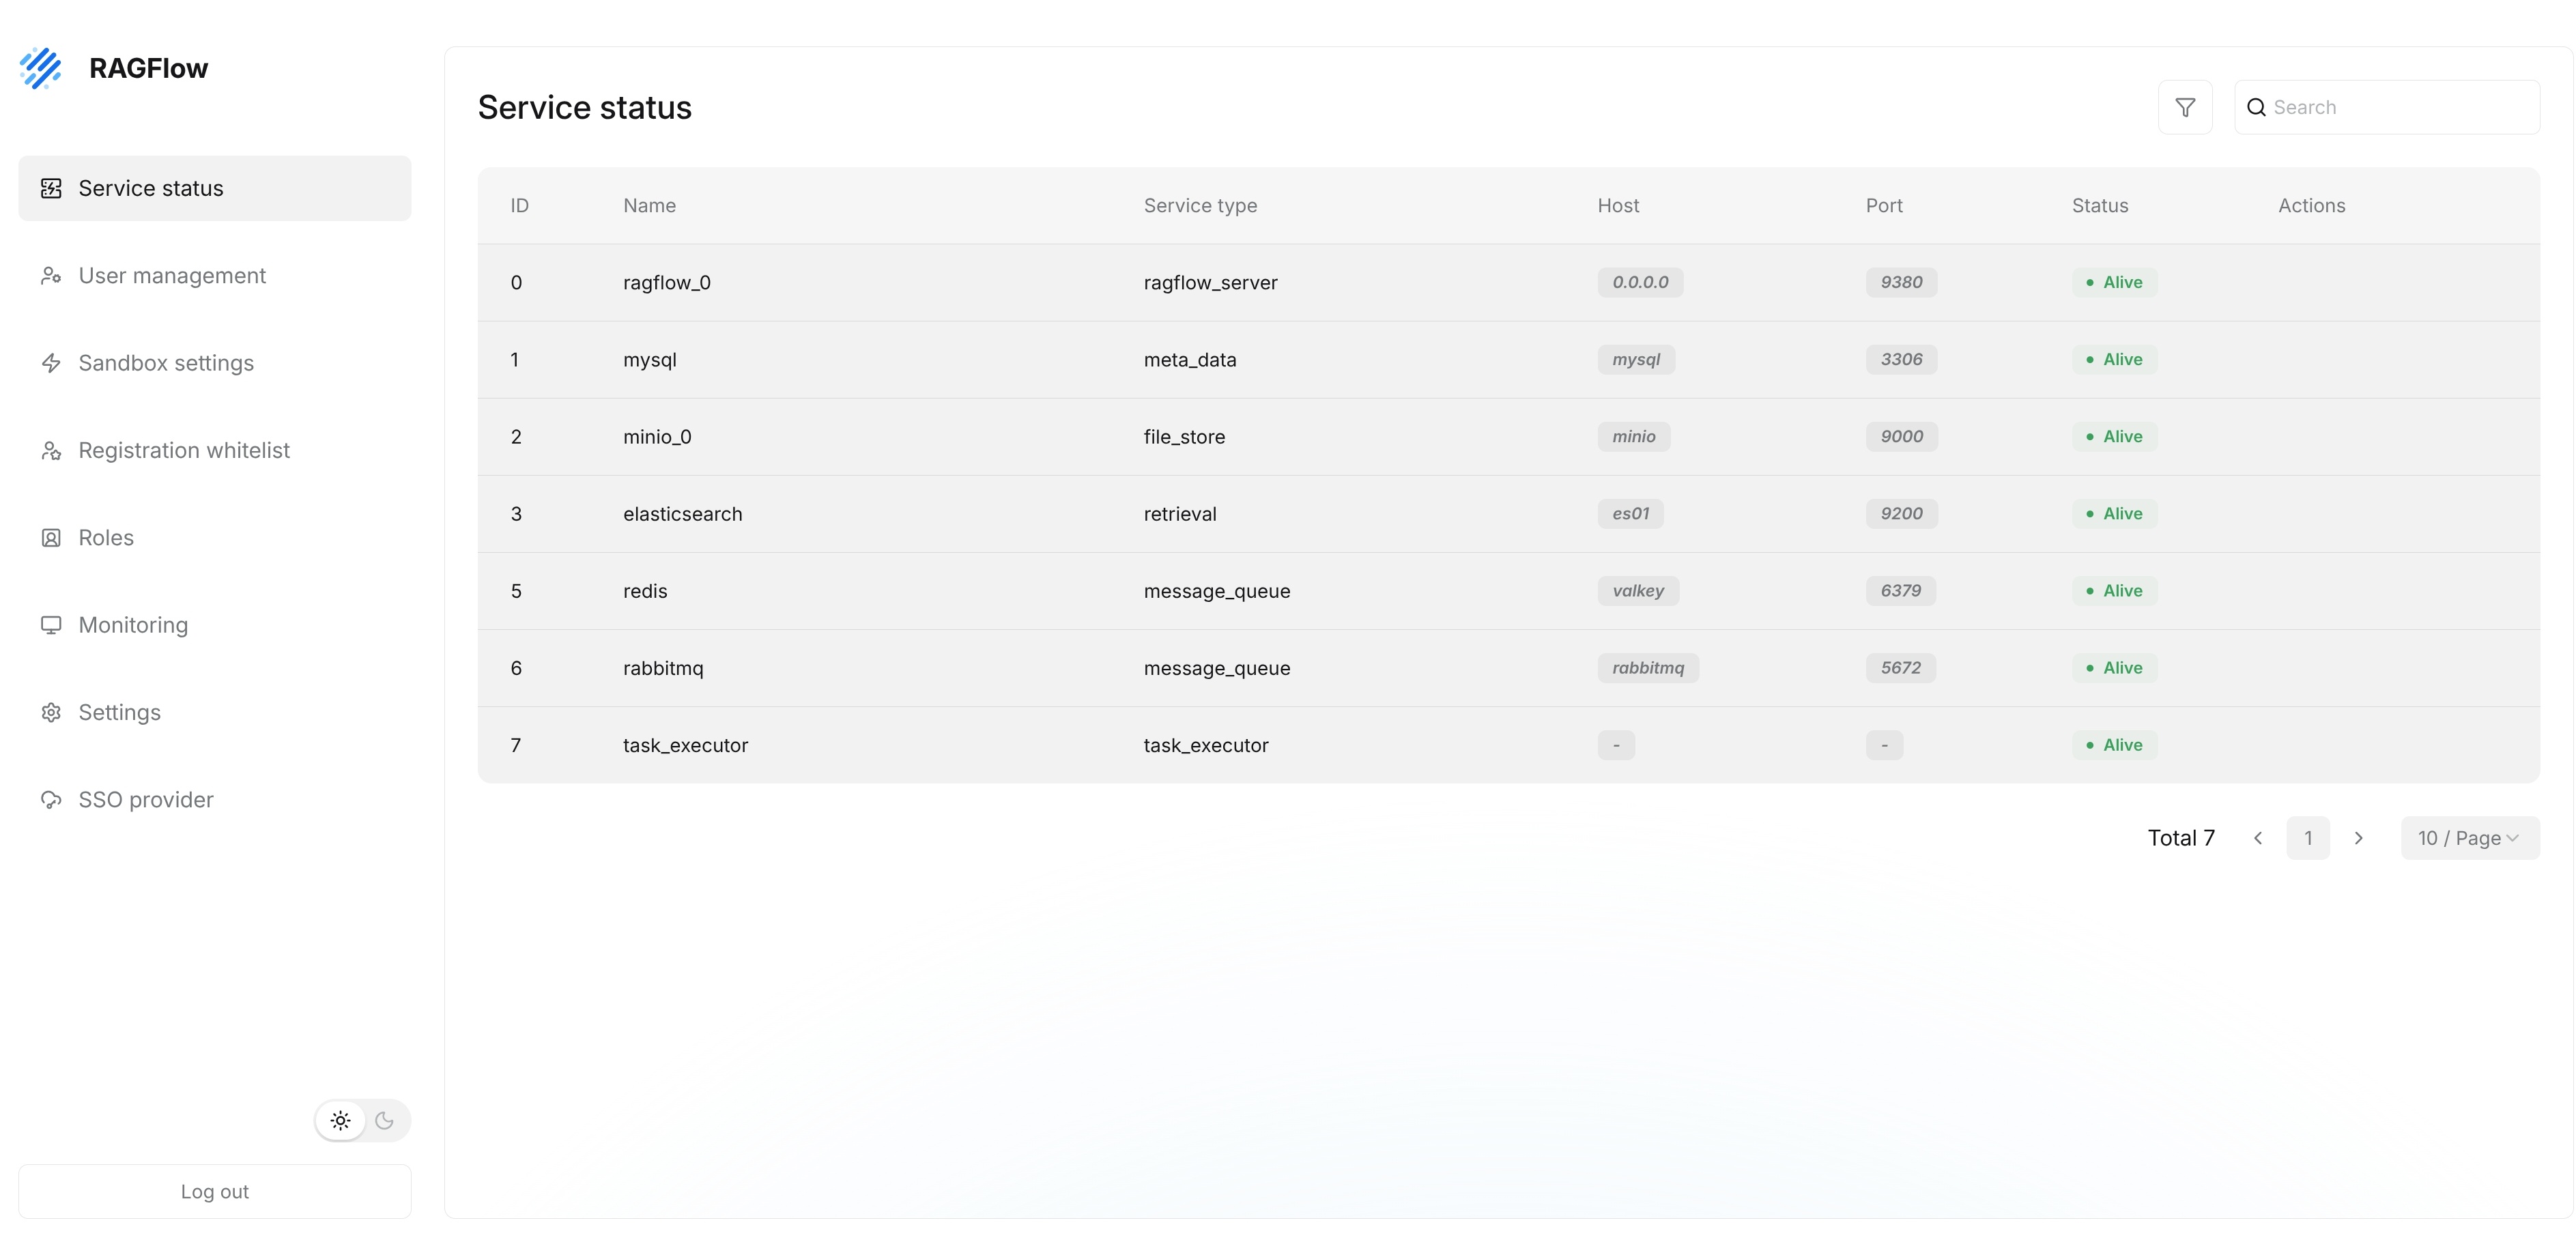
For dependencies, alive means that the corresponding health check succeeded. timeout, not available, or another status indicates that the check failed or that the configured implementation is unavailable. For Go server processes, alive means that Admin received a heartbeat during the preceding 45 seconds; otherwise the status is timeout.
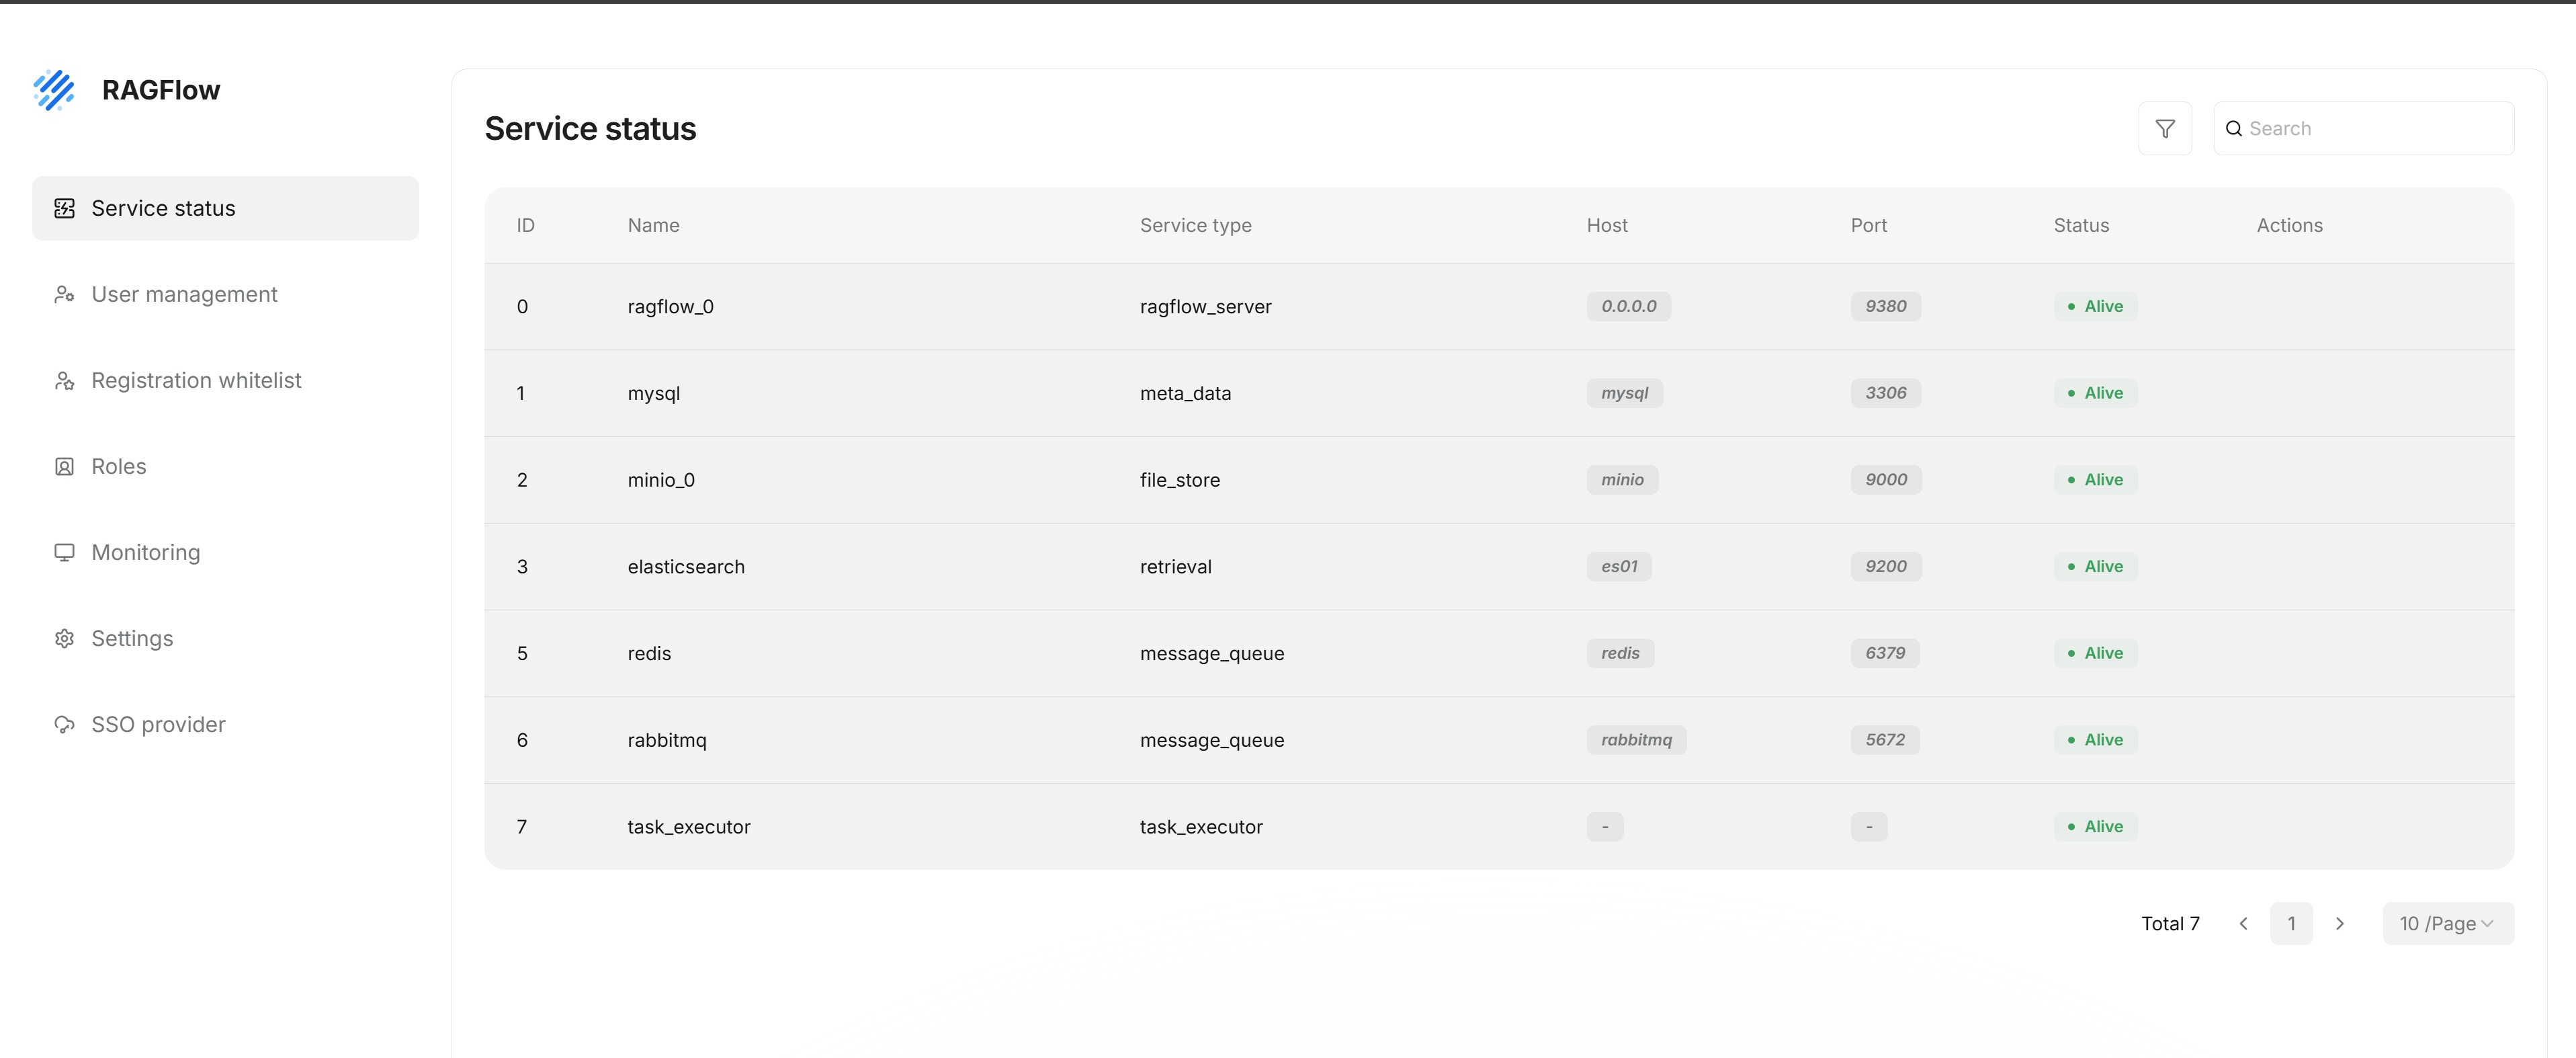
The open-source Go deployment reports the following entries:
| Service type | Entry | How the status is determined |
|---|---|---|
database | MySQL | The server obtains the SQL connection and runs a database ping. |
doc_engine | The configured document engine, such as Elasticsearch or Infinity | The server calls the active document engine's ping operation. |
storage_engine | The configured object storage, such as MinIO | The server calls the active storage implementation's health check. |
cache | Kvrocks | The server checks the configured Kvrocks connection. |
message_queue | NATS | The server reads the status of the active message queue implementation. |
api_server | Each reporting API process | Admin evaluates the process heartbeat. |
ingestor | Each reporting Ingestor process | Admin evaluates the process heartbeat. |
file_syncer | Each reporting Syncer process | Admin evaluates the process heartbeat. |
Only processes that have reported a heartbeat to Admin appear in the process portion of the list. For dependency rows, elapsed records timing information from the corresponding status check; for API, Ingestor, and Syncer rows, it records the time since the latest heartbeat. The host is shown as - and the port as 0 when the configured document engine or storage implementation does not provide an endpoint for the status row.
View Service Details
On the Service status page, administrators can view the service Name, Service type, Host, Port, and Status.
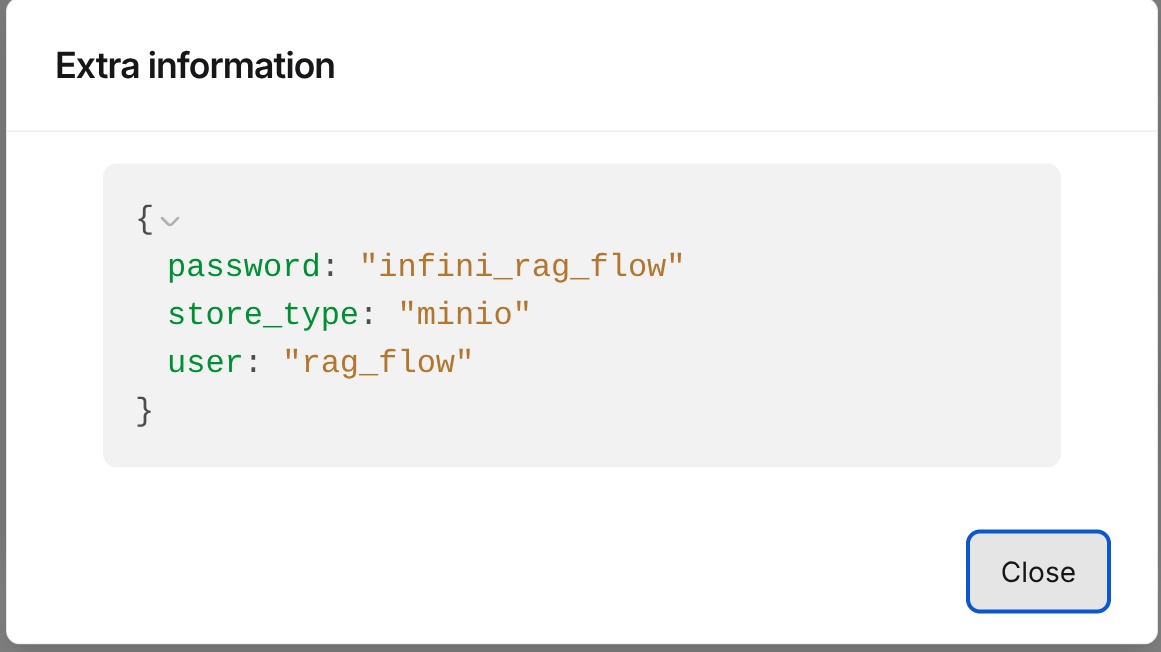
Opening a service from Actions displays the status record returned by the Go Admin service. Depending on the entry, it can include the service name, type, host, port, status, elapsed health-check time, and an error or status message. Use the database or container administration tools provided by your deployment environment when you need database process lists or container operations.
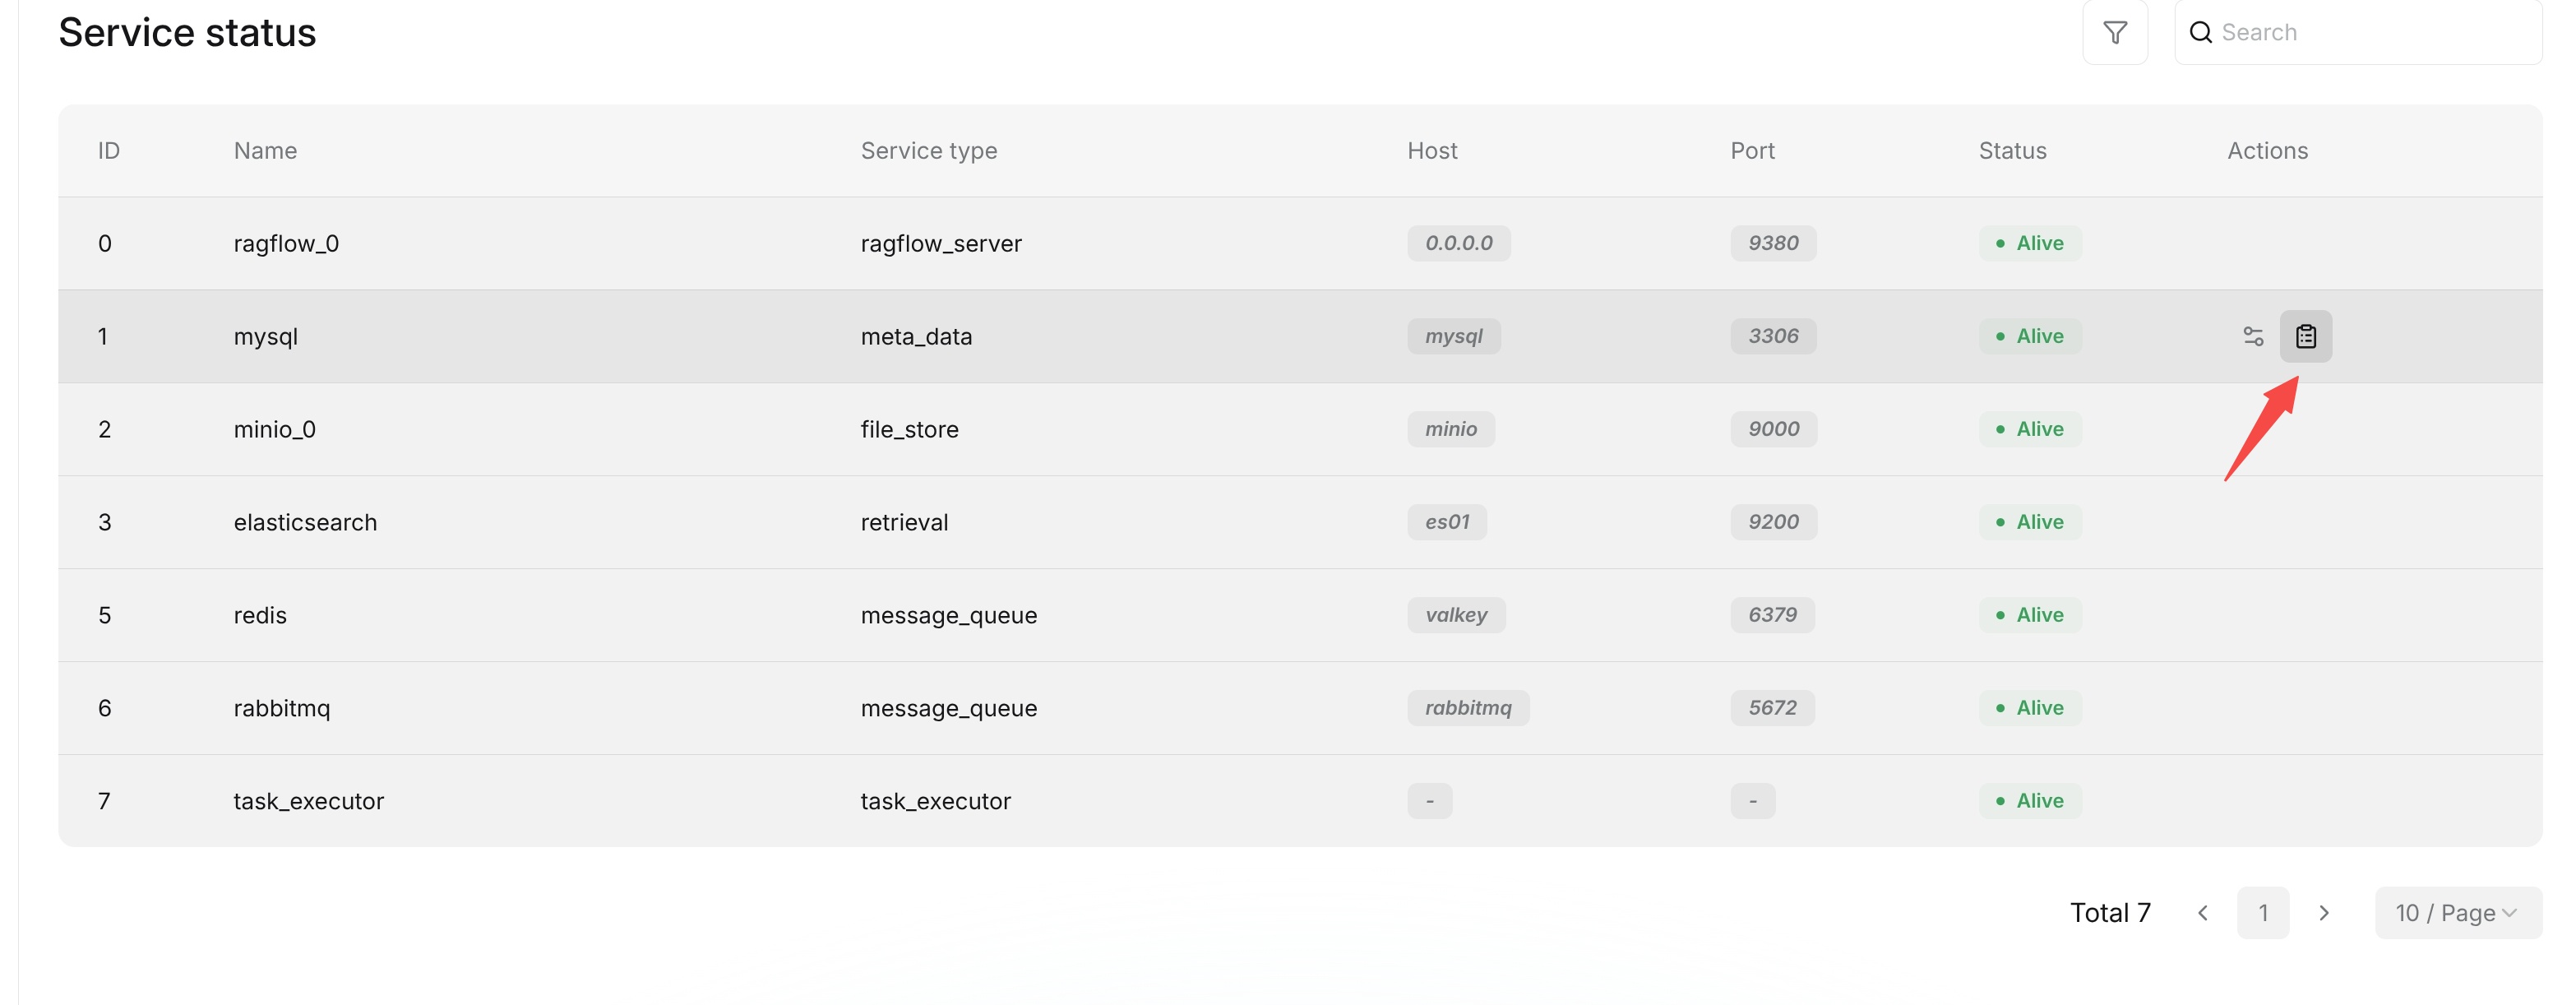
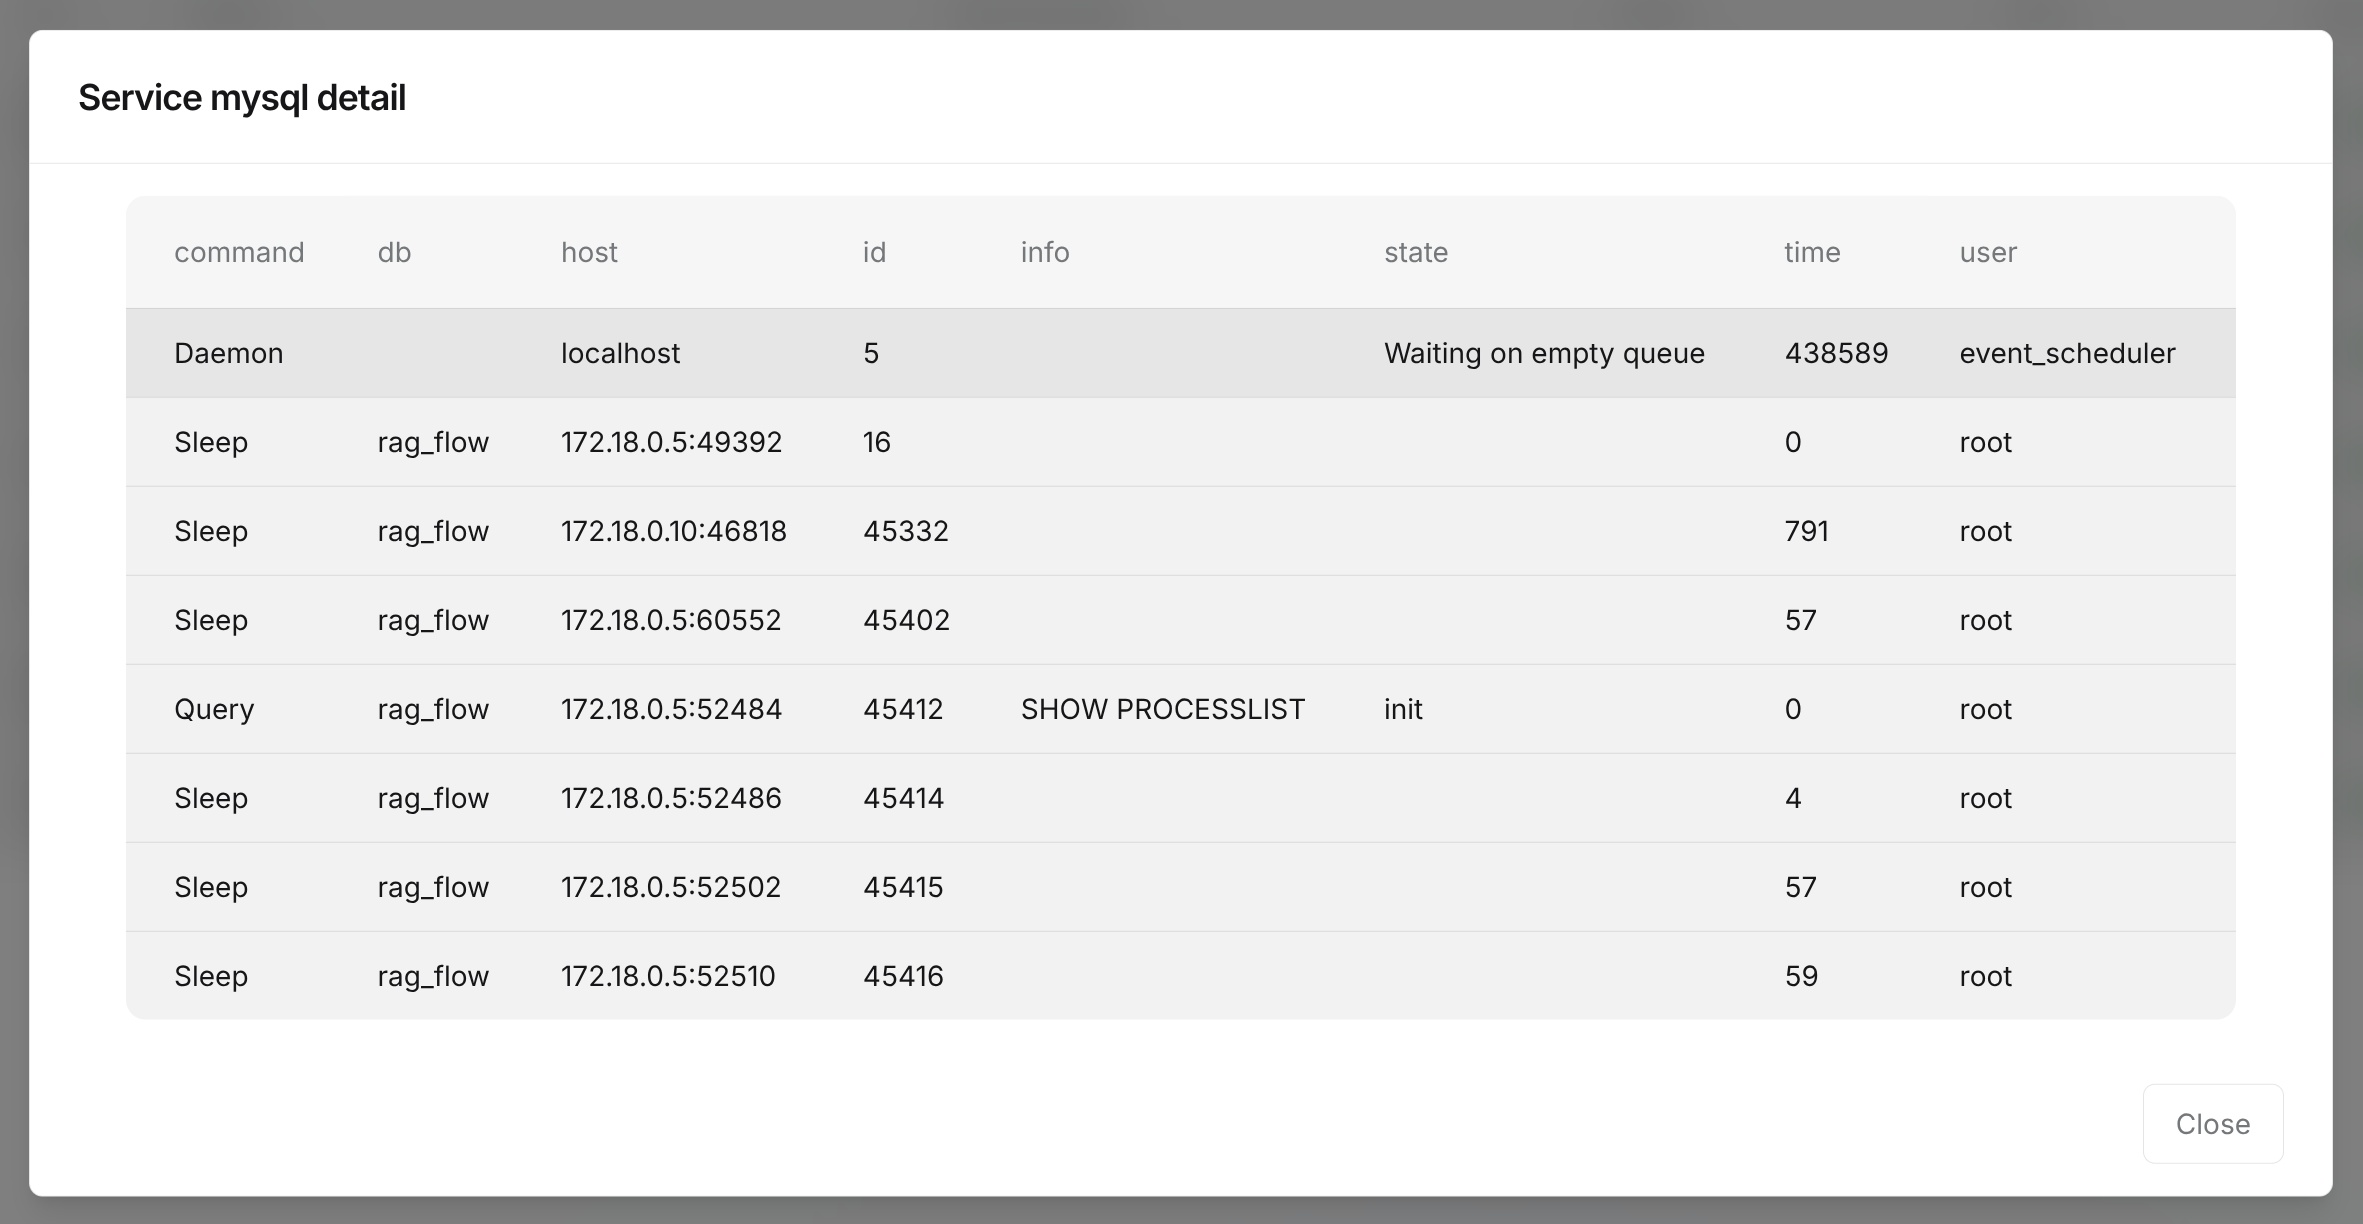
The Extra information dialog displays the elapsed value and message included in the same status record. A failed dependency check can place its error text in the message field.
If a service's status is not alive, record its name, service type, host, port, and message before troubleshooting the corresponding dependency or process.
The Admin UI is mainly used to view service status. It does not provide direct troubleshooting entry points for containers, processes, networks, or logs. For further handling, check the corresponding deployment environment, including service runtime status, port connectivity, service logs, and related configurations. After identifying the cause, restart services, adjust configurations, or perform other recovery operations according to your operations process.